As we are wrapping up an engagement where we’ve been coding with engineers and data scientists in a TelCo company, we are sharing some of the learnings from this engagement.
That’s part of our team’s mission: We code with high impact organization developers to bootstrap the projects they’ll bring to production in Azure and pave the way for others.
In the engagement we were a larger team than usual. Customer had 7 developers and data scientists, 1 subject matter expert. MS brought 1 Business PM, 1 Technical PM, 1 Dev lead, 1 Data Science Lead, 2 Tech Leads (I was one of the two), 7 developers, and 2 data scientists.
That’s definitely more than a pizza team! (Well, we were working from home, so each team member could order a pizza for themselves and nobody starved anyway…)
Because the team was large we split the team based on the epics we had in the backlog. A small team of ~3 would take an epic and take ownership from design to implementation. An epic would be about data transformation pipeline, another one about data science pipeline, another one about clustering, etc. There were also cross epic design meetings.
An additional piece of context is that Microsoft CSE (Commercial Software Engineering) codes with customers. The customer team is the catcher, they move on after we leave. If we didnt come to that point when we leave, they are the ones bringing the project to production. So it’s important the code we leave is cristal clear for the catcher team.
Impediments
We had two important obstacles while running the engagement:
Data needs evolved and the datasets we had became partially obsolete. We didn’t get the right new datasets early enough. Because of that, parts of the project used small datasets (1 day) with the new schema, while other parts of the project stayed with medium datasets (few weeks) that allowed clustering to work.
We didn’t get access to the target pre-production environment early enough. Because of that, we recreated a similar environment in our development Azure subscription, besides the development environment. Let’s call it the simulated target environment.
Without us figuring out, the team started to progress in parallel streams that may not converge. There were unit tests, and plans to develop some integration tests. There was no clear target we could touch, no clear artifact you test, fix and enhance. There was only that mental picture each team member had on top of their mind; was the picture the same for each of us? Was the team still walking in the right and same direction?
Integration tests early in the game
It was time to put higher priority on and end to end integration test running in an Azure DevOps pipeline that everyone could see, touch, fix and enhance. It was also important to have this end to end integration test to make it more obvious when we had to switch datasets. For instance, data transformation pipeline used new raw datasets (with the new schema) to go to bronze, silver and gold datasets, but the gold dataset could not be used for clustering because there was only one day of data while a few weeks were needed. The data science pipeline used an old datasets that had enough data. We still included that in the end to end integration test because the main goal was to reflect what we had built so far, and have something to fix, not be content with different parts that individually worked well.
If i had to run the same engagement again, I would have an integration tests Azure DevOps pipeline much earlier.
End to end walkthrough document
The end to end integration test pipeline didn’t reflect the work from the whole team. There were people working on the development environment itself, others working on data science enhancements (what would be the best clustering algorithm, how would you interpret the clusters, how to detect concept drifts), others on data visualization. All this was not part of the integration tests pipeline.
We already had a lot of documentation in the repo (e.g. design documents written by the epics teams) but that still didn’t provide a quite concise yet holistic view of what was in the repo.
Having an end to end walkthrough document is a way to have a sequential list of things to run, test and read to get up to speed on what the repo contains. Entering the code of a repo is hard. What if we could have a tutorial that walks a new team member through the code and explains how to run it?
For the developers, as they write paragraphs in that document, it’s also a way to make it even more obvious how their work fits in the overall picture.
The end to end walkthrough document has a broader scope than the integration tests. Its central piece is about running the integration tests pipeline and documenting what it does. Offloading most of the code to Azure DevOps pipelines makes it easier to maintain the document. That’s quite obvious for the integration tests but that also works for things like dataset exploration; instead of relying on the reader to use their development environment and run code to explore datasets, why not have that code in an Azure DevOps pipeline? That makes it much easier to check that the code is still up to date (just run the pipeline).
So, what does such a document look like?
Here is the table of content of the end to end walkthrough document for the hat engagement:
Development environment (how to get sources, setup and run your dev container, check that everything works correctly for you)
Explore datasets [1]
Unit Tests (how to run the unit tests from the dev environment)
End to end integration tests: data transformation pipeline, data science pipeline, concept drift detection pipeline, recommendation pipeline (how to run the Azure DevOps integration test pipeline and read the results)
Execute Data Engineering and Data Science Pipelines (how to run CD Azure DevOps pipeline and run the Databricks jobs in the target environment)
DataViz (how to see results in Power BI)
Continuous Integration - CI (understand what the CI pipeline does)
Continuous Deployment - CD (understand what the CD pipeline does)
Data Science Experiments (how to run the data science notebooks) [2]
[1] an Azure DevOps pipeline is associated to that part of the document. It allows to get datasets from the dev environment’s data lake and extract schema and a few rows to get a glance on how the dataset looks like without running an actual notebook. This cannot be seen directly from Azure Data Explorer as datasets would come in formats like ORC, CSV in tar.gz or parquet.
[2] Data scientists worked in notebooks (experiment notebooks), then code was translated by developers into unit tested Python code + bootstrap notebooks. The experiment notebooks were stored in git in a separate folder.
Conclusion
If I had to go back in time, I would have integration tests in an Azure DevOps pipeline much sooner and start the end to end walkthrough document very early also. Any important pull request that would bring new features would update both.
I would also use parts of the end to end walktrhough document to have descriptions of what the code would do in the near future. That’s complementary to the backlog which is at a lower level of details.
Both the end to end walkthrough document and integration tests in an automated pipeline are a great target the whole development team can share, look at, touch, run, fix, enhance.
Visual Studio Codespaces provides cloud-powered development environments for any activity - whether it’s a long-term project, or a short-term task like reviewing a pull request
I use it to have a development environment dedicated to a repo. I like it because it provides me with a Linux environment that includes most of the tools I need, including Docker.
From the command line part of Visual Studio (CTRL-`), I have:
1
2
3
codespace:~/workspace/sample200902$ docker ps -a
CONTAINER ID        IMAGE               COMMAND                  CREATED             STATUS              PORTS               NAMES
443c621d0ef5        1da2d08caca9        "/usr/local/share/do…"   44 seconds ago      Up 42 seconds                           codespaces_5d85d6
The container I see (443c621d0ef5) happens to be the container from which the command line executed. In other words, the development environment is a container, not the docker host itself.
So, if I try to run docker with a volume pointing back to my current folder, I do not see the local folder content. Let’s try:
1
2
3
4
5
codespace:~/workspace/sample200902$ docker run -it --rm -v $PWD:/my-vol alpine sh
/ # ls -al /my-vol
total 8
drwxr-xr-x    2 root     root          4096 Sep  2 16:33 .
drwxr-xr-x    1 root     root          4096 Sep  2 16:33 ..
Why? Because $PWD points to current working dir on the host, not on the dev container.
How to workaround it?
Both development environment and container can meet in a common folder, on the docker host.
By inspecting our development environment we can find one:
basically, /mnt/containerTmp on the host is /tmp in the dev container.
So let’s try to mount /mnt/containerTmp in the docker container to see if we can see what’s in the dev container’s /tmp folder:
1
2
3
4
5
6
7
codespace:~/workspace/sample200902$ cp some-content.txt /tmp/content-copy.txt
codespace:~/workspace/sample2009$ docker run -it --rm -v /mnt/containerTmp/:/my-vol alpine sh
/ # ls /my-vol/*.txt
/my-vol/content-copy.txt
/ # cat /my-vol/content-copy.txt
hey, I'm a text file in the dev environment.
/ #
I had to use that in a project where we needed to interact with binary files from within the container, and be able to test from within the development environment. This trick helped me!
Last summer, I started an open source project called boontadata-streams. It is an environment where one can compare big data streaming engines like Apache Flink, Apache Storm or Apache Spark Streaming to name a few.
and here is what we get when extracting time from the event data (event time):
1
2
3
4
5
6
7
8
9
10
11
Comparing ingest device and flink for m1_sum
--------------------------------------------------
5 exceptions out of 21

Exceptions are:
            window_time                             device_id category  m1_sum_ingest_devicetime  m1_sum_flink  delta_m1_sum_ingestdevice_flink
4   2016-12-05 14:53:35  b8c0c5c4-9189-4a0d-a96b-55ca4adafe14    cat-1                       388           NaN                              NaN
9   2016-12-05 14:53:35  b8c0c5c4-9189-4a0d-a96b-55ca4adafe14    cat-2                       496           NaN                              NaN
14  2016-12-05 14:53:35  b8c0c5c4-9189-4a0d-a96b-55ca4adafe14    cat-3                       296           NaN                              NaN
15  2016-12-05 14:51:10  b8c0c5c4-9189-4a0d-a96b-55ca4adafe14    cat-4                        49           NaN                              NaN
20  2016-12-05 14:53:35  b8c0c5c4-9189-4a0d-a96b-55ca4adafe14    cat-4                       537           NaN                              NaN
this second result is better. All the differences can be explained: those with the 2016-12-05 14:53:35 time window happen because no further event was sent that could trigger the calculation of this time Window; the 2016-12-05 14:51:10 time window for cat4 corresponds to an event that was sent too late by the IOT simulator (on purpose) so that the streaming engine cannot take it into account.
Here are the versions used in the current implementation:
Component
version
comments
Python
Python 3.5.2
Anaconda 4.2.0 (64-bit)
Apache Kafka
0.10
Apache Flink
1.1.3
Apache Cassandra
3.9
Apache Zookeeper
3.4.9
The project leverages Docker containers, it can run on a single Ubuntu VM with ~14 GB of RAM. Of course, you are welcome to contribute. We may even let you use one of our Azure VMs while you develop. You can contact me: contact à boontadata.io.
The pom and the code
In order to write that, I relied on sample code on the Internet about Flink consuming Kafka and Flink writing to Cassandra. Still, it took me some time to put everything together.
What I consumed most of my time on was the Maven configuration file: pom.xml.
I’m not a Java specialist, so I gave up on the JAR size optimization and preferred to have a uber-jar.
I couldn’t make the Kafka 0.10 client working so I used Kafka 0.8.2. This version of the client needs to communicate to Zookeeper. Still, it can read from Kafa 0.10.
In terms of Flink code, I created a pipeline that does the following:
reads from Kafka
parses message
assigns timestamp and watermarks from event data
creates a time window in order to remove duplicates (the key is the message id)
creates a time window in order to aggregate (based on device id, message category)
sends some debugging information to Cassandra debug table about events and their time windows
aggredates data
writes results to Cassandra agg_events table
Feel free to visit the GitHub repo, or use the code as samples, or fix it and create a pull request when you find ways to improve it, or add your own implementation on other streaming engines like Storm, Spark streaming or others.
A copy of the most significant pieces of code
The rest of this post is a copy of the most significant pieces of code
/** * Skeleton for a Flink Streaming Job. * * For a full example of a Flink Streaming Job, see the SocketTextStreamWordCount.java * file in the same package/directory or have a look at the website. * * You can also generate a .jar file that you can submit on your Flink * cluster. * Just type * mvn clean package * in the projects root directory. * You will find the jar in * target/quickstart-0.1.jar * From the CLI you can then run * ./bin/flink run -c io.boontadata.flink1.StreamingJob target/quickstart-0.1.jar * * For more information on the CLI see: * * http://flink.apache.org/docs/latest/apis/cli.html */ public class StreamingJob { private static final String VERSION = "161205a";
private static final Integer FIELD_MESSAGE_ID = 0; private static final Integer FIELD_DEVICE_ID = 1; private static final Integer FIELD_TIMESTAMP = 2; private static final Integer FIELD_CATEGORY = 3; private static final Integer FIELD_MEASURE1 = 4; private static final Integer FIELD_MESAURE2 = 5;
// set up the streaming execution environment final StreamExecutionEnvironment env = StreamExecutionEnvironment.getExecutionEnvironment(); env.enableCheckpointing(5000); // checkpoint every 5000 msecs env.setParallelism(2); if (timeCharacteristic.equals("EventTime")) { env.setStreamTimeCharacteristic(TimeCharacteristic.EventTime); } else if (timeCharacteristic.equals("ProcessingTime")) { env.setStreamTimeCharacteristic(TimeCharacteristic.ProcessingTime); } else if (timeCharacteristic.equals("IngestionTime")) { env.setStreamTimeCharacteristic(TimeCharacteristic.IngestionTime); }
Format windowTimeFormat = new SimpleDateFormat("yyyy-MM-dd HH:mm:ss");
// properties about Kafka Properties kProperties = new Properties(); kProperties.setProperty("bootstrap.servers", "ks1:9092,ks2:9092,ks3:9092"); kProperties.setProperty("zookeeper.connect", "zk1:2181"); kProperties.setProperty("group.id", "flinkGroup");
// get data from Kafka, parse, and assign time and watermarks DataStream<Tuple6<String, String, Long, String, Long, Double>> stream_parsed_with_timestamps = env .addSource(new FlinkKafkaConsumer082<>( "sampletopic", new SimpleStringSchema(), kProperties)) .rebalance() .map( new MapFunction<String, Tuple6<String, String, Long, String, Long, Double>>() { private static final long serialVersionUID = 34_2016_10_19_001L;
// cf https://ci.apache.org/projects/flink/flink-docs-release-1.1/apis/streaming/event_timestamps_watermarks.html /** * This generator generates watermarks assuming that elements come out of order to a certain degree only. * The latest elements for a certain timestamp t will arrive at most n milliseconds after the earliest * elements for timestamp t. */ public class BoundedOutOfOrdernessGenerator implements AssignerWithPeriodicWatermarks<Tuple6<String, String, Long, String, Long, Double>> { private final long maxOutOfOrderness = 1_000L; // 1 second private long currentMaxTimestamp = 0;
@Override public long extractTimestamp(Tuple6<String, String, Long, String, Long, Double> element, long previousElementTimestamp) { long timestamp = element.f2; // get processing timestamp from current event currentMaxTimestamp = Math.max(timestamp, currentMaxTimestamp); return timestamp; }
@Override public Watermark getCurrentWatermark() { // return the watermark as current highest timestamp minus the out-of-orderness bound return new Watermark(currentMaxTimestamp - maxOutOfOrderness); } }
Ce tutoriel a été rédigé par Eugénie Vinet, stagiaire à la Direction Technique de Microsoft France de avril à août 2016 avec l’aide de son maître de stage Philippe Beraud, Chief Security Advisor à la Direction Technique. Je remercie Eugénie et Philippe pour cette contribution.
Synchroniser une application de fonction avec un concentrateur IoT
Pour créer une application de fonction avec Azure Function App, procédez comme suit :
2/ Cliquez sur New en haut à gauche et cherchez Function App.
3/ Cliquez sur create. Entrez ensuite un nom, lié le à un de vos groupes de ressources existants (ou à défaut créez-en un nouveau). Si vous voulez que votre application de fonction fonctionne en continu, choisissez un plan de service B1 associé au minimum. Le portail Function App s’affiche
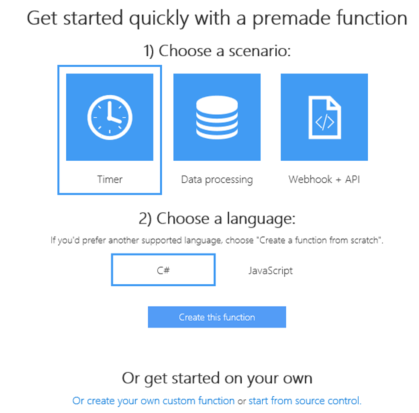
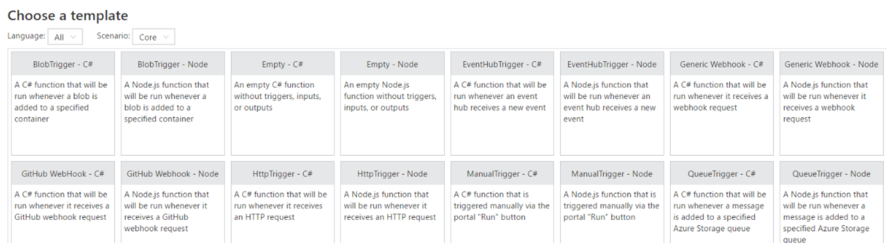
4/ Cliquez sur **Or create your own custom function en bas. **Une liste des modèles disponibles s’affiche pour votre application de fonction.
5/ Selon votre choix de programmation (C# ou Node) cliquez sur EventHubTrigger – C# ou EventHubTrigger – Node. Azure Function App propose de déclencher une fonction à partir d’un événement dans un concentrateur d’événements, mais pas dans un concentrateur IOT; cependant, un concentrateur IOT peut être vu comme un concentrateur d’événements. C’est ce que nous allons faire.
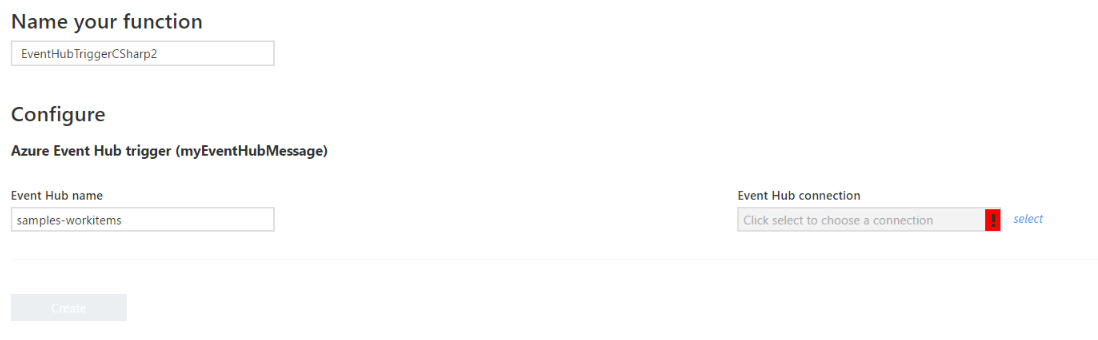
6/ Précisez le nom de votre application de fonction et configurez la connexion avec votre concentrateur IoT dans Event Hub connection.
Pour connaître le nom et la chaîne de connexion du concentrateur IoT :
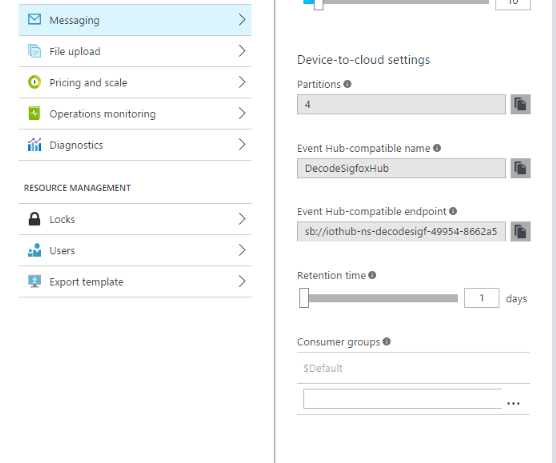
a. Rendez-vous dans les paramètres de votre concentrateur IoT puis cliquez sur Messaging.
b. Notez la valeur de Event-Hub compatible name (par exemple DecodeSigfoxHub dans notre illustration) ainsi que celle de Compatible endpoint.
c. Toujours au niveau de votre concentrateur IoT, allez ensuite dans Shared Access Policies et copier la connection string – primary Key. Enlevez la partie HostName à la chaine de caractères de manière à ne garder que SharedAccessKeyName et SharedAccessKey. Vous obtenez par exemple : SharedAccessKeyName=iothubowner;SharedAccessKey=MrsSPDzU5=8g2gZZPKXOJ9EJ5RDlo2PVzmPuGniLRwQ=
d. Retournez dans la fenêtre de votre application de fonction - ne fermez pas la fenêtre de paramètres de votre concentrateur IoT, vous en aurez besoin plus tard -. Nommez votre application de fonction comme bon vous semble :)
e. Dans Event Hub Name, entrez la valeur précédente de Event-Hub compatible name. Attention cependant, il ne supporte que les noms en minuscule. S’il y a des majuscules dans votre valeur de Event hub compatible name, passez tout en minuscule (par exemple decodesigfoxhub dans notre illustration)
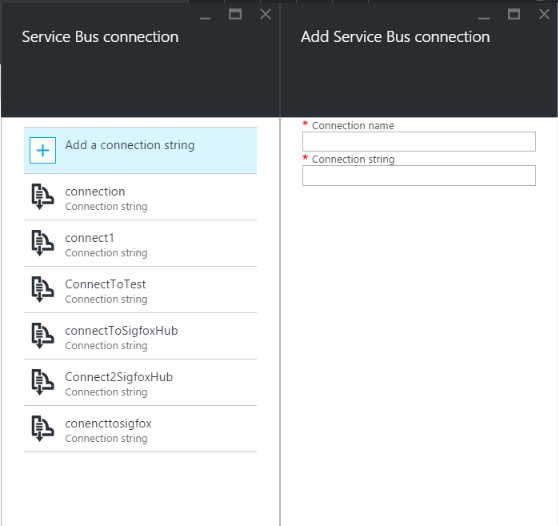
f. Cliquez ensuite sur select à côté de Event Hub connection. Cliquez ensuite sur** Add a connection** string en haut à droite.
g. Dans Connection name, spécifiez le nom que vous souhaitez.
h. Dans Connection string, précisez : Endpoint=<CompatibleEndpoint><SharedAccessKeyName><SharedAccessKey> Vous obtenez une chaine de caractère semblable à : Endpoint=sb://iothub-ns-decodesigf-499548662a53f6c.servicebus.windows.net/;SharedAccessKeyName=iothubowner;SharedAccessKey=MrsSPDzU5=8g2gZZPKXOJ9EJ5RDlo2PVzmPuGniLRwQ=
7/ Validez. Votre application de fonction s’exécutera alors à chaque message reçu par l’utilisateur. Vous pouvez alors modifier les informations que vous recevez de votre concentrateur IoT pour les renvoyer autre part ou les stocker par exemple. Vous trouverez ci-après un exemple concret d’usage d’une application de fonction dans notre contexte, à savoir le décodage de trames Sigfox pour les renvoyer sur la solution préconfigurée de surveillance à distance (Cf. portail associé à l’adresse https://www.azureiotsuite.com/) .
Exemple avec IoT Suie - Objet Sigfox
Nous vous proposons dans cette section un exemple de projet utilisant Azure Function App avec un concentrateur IoT. La solution préconfigurée de surveillance à distance s’attend recevoir des messages sur son concentrateur IoT de type :
1
2
3
4
5
6
{
	DeviceId = XX,
	Humidity = XX,
	Temperature = XX,
	ExternalTemperature = XX
}
Dans ce projet nous voulons utiliser des objets Sigfox (voir ici http://makers.sigfox.com/#about) qui envoient des trames de type : « 422D17 » avec 42 l’identifiant du type d’objet, 2D l’humidité (45%) et 17 la température (en décimal = 23°C). » On va supposer que l’humidité et la température sont deux entiers qui vont de 0 à 100.
• Avoir créé et provisionné une solution préconfigurée de type Solution de surveillance à distance sur le site dédié à l’adresse http://www.azureiotsuite.com/.
• Avoir suivi l’étape précédente de synchronisation d’une Function App avec un concentrateur IoT en utilisant le concentrateur IoT Hub lié à l’objet Sigfox.
Si ces prérequis sont satisfaits, les étapes de mise en œuvre sont les suivantes :
• Etape 1 – Ajout de l’objet préconfiguré.
• Etape 2 – Remplissage du fichier JSON.
• Etape 3 – Ajout des paquets.
• Etape 4 – Contenu de votre application de fonction.
Nous les développons dans l’ordre au travers d’une section dédiée propre.
Connectez-vous avec votre compte. Comme cela a été indiqué précédemment, vous devez disposer de privilèges d’administration pour pouvoir enregistrer un objet. De plus, réalisez cette étape UNIQUEMENT si l’objet n’apparait pas dans la liste des appareils du concentrateur IoT de l’environnement de démonstration (vous pouvez vérifié via le portail Azure ou via l’application Device Explorer). Si votre objet est déjà présent dans la liste, il faudra le supprimer en utilisant le Device Explorer. L’application Device Explorer est téléchargeable à l’adresse https://github.com/Azure/azure-iot-sdks/releases. Le répertoire d’installation par défaut de cette application est : C:\Program Files (x86)\Microsoft\DeviceExplorer
Une fois sur le site, dans la liste des solutions approvisionnées, sélectionnez la Solution de surveillance à distance, c.à.d. la solution .azurewebsite.net.
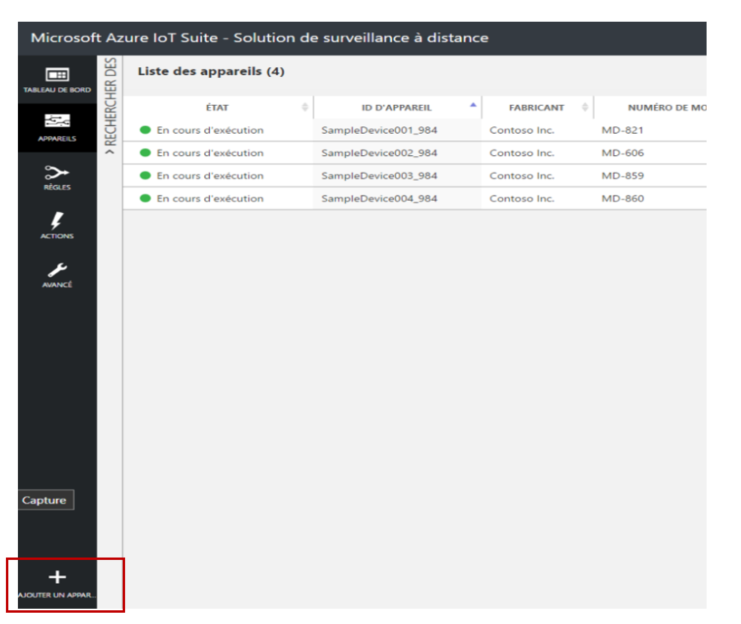
Cliquez en bas à gauche sur Ajouter un appareil (ou Add a device en anglais). L’étape 1 d’ajout d’un appareil s’affiche.
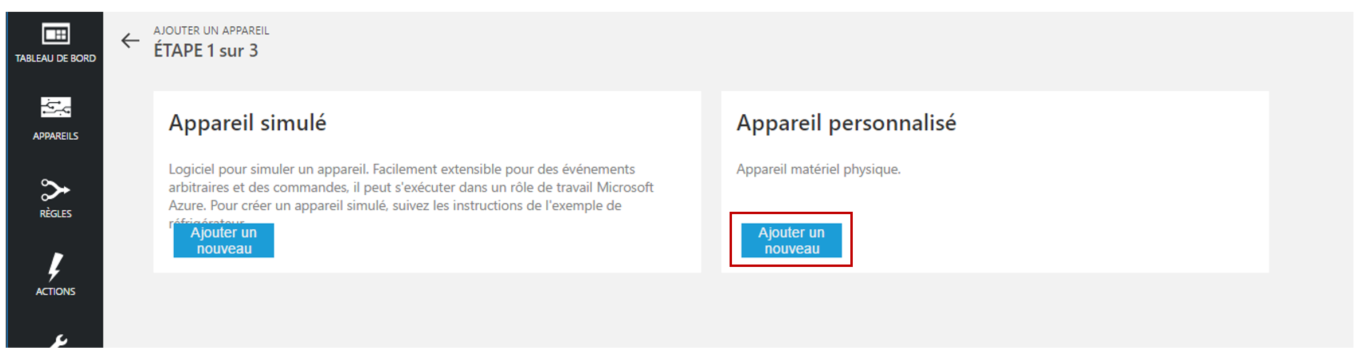
Dans le cadre Appareil personnalisé, sélectionnez Ajouter un nouveau. L’étape 2 s’affiche.
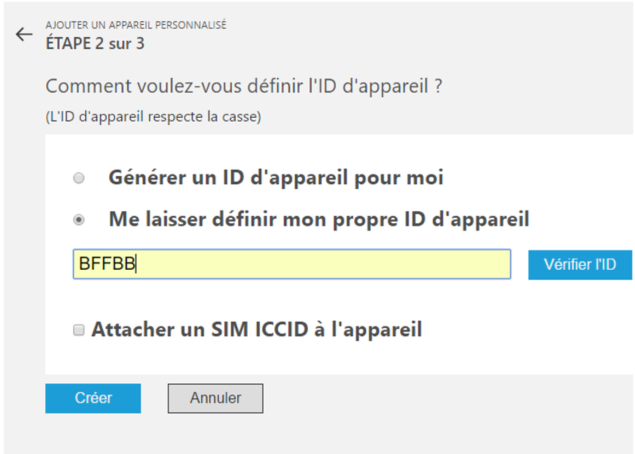
Sélectionnez l’option Me laisser définir mon propre ID d’appareil et donnez lui le même ID que dans Sigfox /!\ ça ne marchera pas si vous choisissez un id différent.
Cliquez sur Vérifier l’ID. L’ID doit être disponible.
Cliquez enfin sur Créer. A ce stade, l’objet n’est pas activé dans la plateforme. Il va falloir modifier les informations relatives à l’objet dans la base NoSQL DocumentDB. Pour cela, connectez-vous au portail d’Azure à l’adresse https://portal.azure.com et réalisez l’étape suivante.
Etape 2 – Remplissage du fichier JSON
Pour remplir le fichier JSON d’informations lié à l’objet, procédez comme suit :
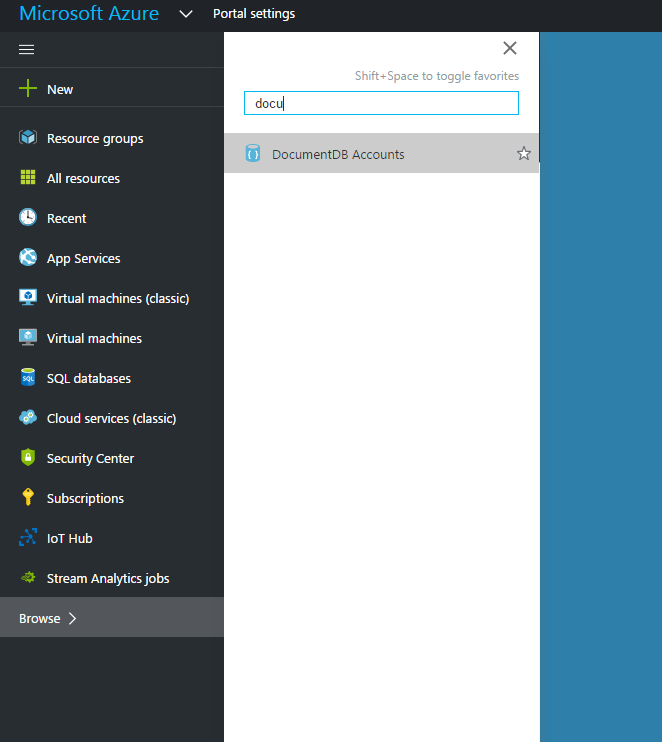
Rendez-vous dans la rubrique DocumentDB Accounts sur le portail Azure à l’adresse https://portal.azure.com.
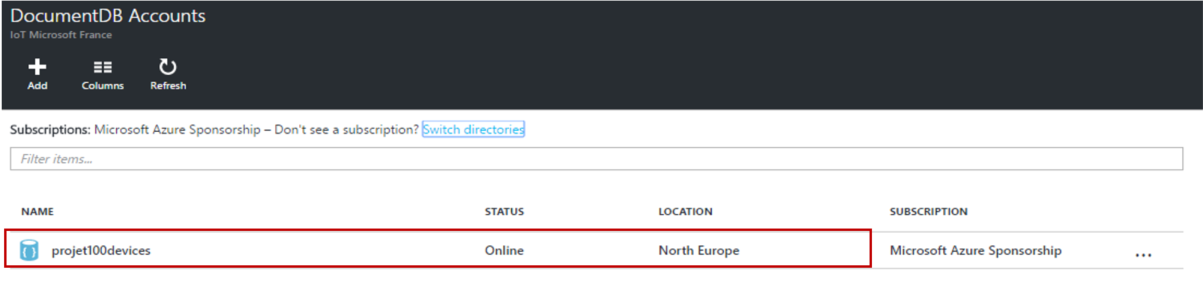
Sélectionner le compte DocumentDB du projet :
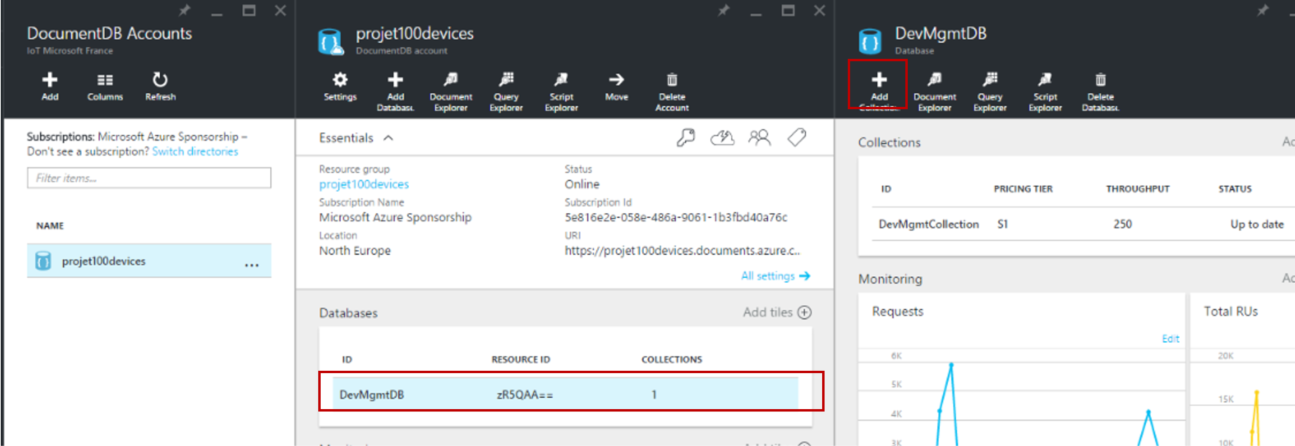
Cliquez ensuite sur votre base de données DevMgmtDb (1). Dans DevMgmtDB, cliquez sur Document Explorer (2). Vous devriez voir apparaitre une liste comme celle-ci :
Si vous n’avez pas réalisé l’étape 3 si l’objet existait déjà dans le concentrateur IoT, il est possible qu’il n’y ait aucun fichier relatif à l’objet dans la base de données. Il va alors falloir en créer un en cliquant en haut à gauche. Par contre si vous aviez réalisé l’étape 3, le fichier relatif au device devrait se trouver dans la liste. Il devrait avoir un nom de type « 2f23278e-0e82-4850-86f5-b5c3f83a8850 » ou bien le nom du device comme « BFFBA ». Pour vérifier si un fichier est lié à votre objet, il suffit de l’ouvrir et de lire le DeviceID. Il doit être identique à l’ID que vous avez enregistré sur la page web de la solution de surveillance à distance et identique à l’ID de l’objet enregistré sur le portail Sigfox. (1) Supprimez ou modifiez le contenu du fichier dont le DeviceID est le nom de votre objet et recopier le texte à droite puis complétez/modifiez les zones en jaune comme suit :
    HubEnabledState : doit être passé à true.
    DeviceState : doit être normal.
    CreatedTime : doit être de la forme : AAAA-MM-JJThh:mm:ss
Avec AAAA l’année, MM le mois, JJ le jour, hh l’heure, mm les minutes et ss les secondes.
Il est recommandé de mettre la date et l’heure qu’il est au moment où vous remplissez le fichier mais cela ne va pas avoir d’impact sur le fonctionnement général de la surveillance à distance.
    SerialNumber : doit préciser le numéro de série de l’objet si celui en est « équipé ». A défaut, écrivez le nom de l’objet entre guillemets.
    Manufacturer : doit préciser le nom du fabricant de l’objet entre guillemets.
    ModelNumber : doit préciser le numéro de modèle de l’objet si celui en est « équipé ». A défaut, écrivez le nom de l’objet entre guillemets
    FirmwareVersion, Platform, Processor et InstalledRam : si vous ne les connaissez pas pour le device utilisé vous pouvez écrire « None ».
    Latitude et Longitude : vous avez le choix de son emplacement. L’objet s’affichera à l’endroit indiqué sur la carte. Vous pouvez vous aider de ce site : http://www.latlong.net/ pour trouver la longitude et la latitude d’un endroit précis. Attention : la longitude et la latitude ne doivent pas être écrites entre guillemets sur le document.
    Id : sera l’ID du document que vous avez créé/modifié. Il est recommandé d’utiliser le nom de l’objet afin de retrouver plus facilement le document.
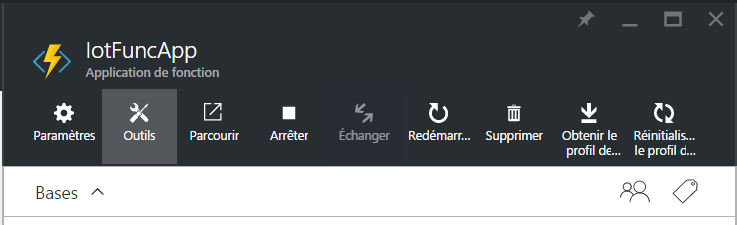
Rendez-vous dans les outils de votre application de fonction.
Cliquez sur Kudu puis sur accédez. Vous vous retrouvez donc sur le système de gestion des fichiers de votre application de fonction.
Allez dans Debug Console puis PowerShell. En utilisant la commande ou bien en utilisant l’explorateur de fichier au-dessus rendez-vous sur D:\home\site\wwwroot<NomdevotreApplicationDeFonction>>
Ajoutez alors un fichier project.json qui contient les lignes suivantes - un simple glissé-déposé suffit - :
Etape 4 – Définition du contenu de votre application de fonction
Pour définir le contenu de votre application de fonction, procédez comme suit :
1/ Retournez sur votre application de fonction et ajoutez la classe DataToReceive. Le contenu dépendra du contenu du JSON entré pour le callback de votre Device Type dans le portail Sigfox. Si vous avez par exemple ce JSON :
Votre classe DataToReceive doit ressembler à cela :
public class DataToReceive
{
    public string device { get; set; }
    public string data { get; set; }
    public double time { get; set; }
    public string seqNumber { get; set; }
    public string rssi { get; set; }
    public string snr { get; set; }
    public string station { get; set; }
}
Il faut qu’il y ait au minimum les variables « device » et « data ».
2/ Créer ensuite une classe DataToSend qui réunira les informations que vous voulez envoyer dans votre solution préconfigurée de surveillance à distance. Nous envoyons ici que l’Id de l’objet, la température et l’humidité. Vous pouvez ajouter le paramètre External Température.
1
2
3
4
5
6
public class DataToSend
{
    public string DeviceId { get; set; }
    public double Humidity { get; set; }
    public double Temperature { get; set; }
}
3/ Créez la classe SendToIotHub comme suit. Remplacez bien les valeurs de connectionString et d’iotHubUri par les éléments relatifs au concentrateur IoT de la solution préconfigurée.
4/ Ajoutez les directives using « de circonstance » au début de votre application de fonction :
1
2
3
4
5
using Microsoft.Azure.Devices;
using Microsoft.Azure.Devices.Client;
using System;
using Microsoft.Azure.Devices.Common.Exceptions;
using Newtonsoft.Json;
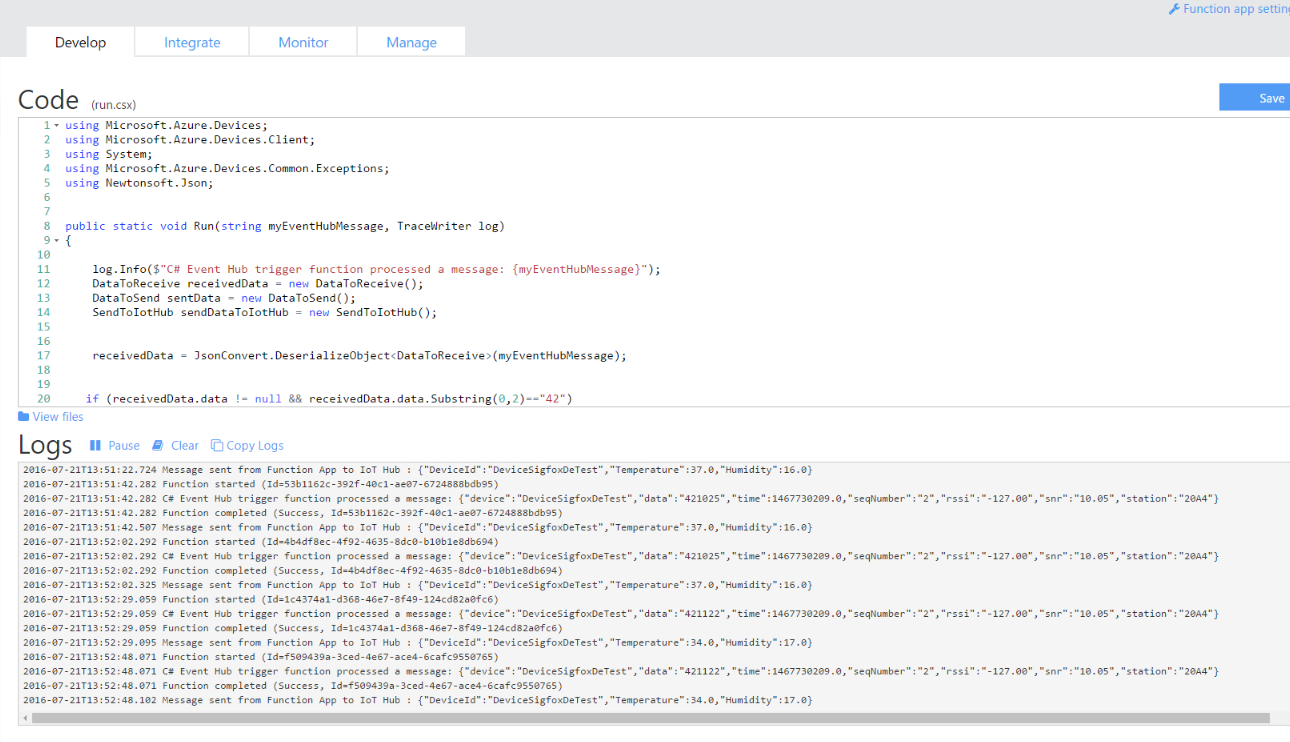
5/ Complétez maintenant la méthode Run :
1
2
3
4
5
6
7
8
9
10
11
12
13
14
15
16
17
18
public static void Run(string myEventHubMessage, TraceWriter log) { log.Info($"C# Event Hub trigger function processed a message: {myEventHubMessage}");
DataToReceive receivedData = new DataToReceive(); DataToSend sentData = new DataToSend(); SendToIotHub sendDataToIotHub = new SendToIotHub(); receivedData = JsonConvert.DeserializeObject<DataToReceive>(myEventHubMessage);
Vous obtiendrez quelque chose de similaire à la capture qui suit si tout va bien :
Vous devriez voir dans les logs les messages reçus et envoyés si vous gardez les lignes de code log.info (…..).
Bien sûr, nous partons du principe que les trames à utiliser sont de la forme « 422D17 » (comme développé précédemment) mais il est possible que vous ayez à faire des calculs sur chaque élément de votre trame pour obtenir les valeurs décimales renvoyées par vos capteurs. Pour ceci, renseignez-vous auprès du constructeur de l’objet.
Here is a sample test to show how Docker Swarm and Docker Compose simplify network management.
We’ll deploy a topology of 3 containers and see how they can reach each other. In the first case, we deploy it on a single node. In the second case, we deploy it on a 2 host swarm cluster.
The Swarm cluster is created as a Swarm Azure Container Service instance with the main following parameters:
Orchestrator configuration: Swarm (btw, other option for ACS is DC/OS)
Agent count: 2
Agent virtual machine size: (leave default)
Master count: 1
DNS prefix for container service: myacs
Two files are created
The Dockerfile contains:
1
2
3
FROM busybox

ENTRYPOINT ["init"]
The docker-compose.yml file has the following content:
benjguin@benjguinu1605a:~/simpletest$ docker-compose up -d
Creating network "simpletest_default" with the default driver
Creating n1
Creating n3
Creating n2
benjguin@benjguinu1605a:~/simpletest$ docker-compose ps
Name   Command   State   Ports
------------------------------
n1     init      Up
n2     init      Up
n3     init      Up
benjguin@benjguinu1605a:~/simpletest$ docker exec n1 ping -c 2 n2
PING n2 (172.19.0.4): 56 data bytes
64 bytes from 172.19.0.4: seq=0 ttl=64 time=0.086 ms
64 bytes from 172.19.0.4: seq=1 ttl=64 time=0.067 ms

--- n2 ping statistics ---
2 packets transmitted, 2 packets received, 0% packet loss
round-trip min/avg/max = 0.067/0.076/0.086 ms
benjguin@benjguinu1605a:~/simpletest$ docker exec n1 ping -c 2 n3
PING n3 (172.19.0.3): 56 data bytes
64 bytes from 172.19.0.3: seq=0 ttl=64 time=0.072 ms
64 bytes from 172.19.0.3: seq=1 ttl=64 time=0.072 ms

--- n3 ping statistics ---
2 packets transmitted, 2 packets received, 0% packet loss
round-trip min/avg/max = 0.072/0.072/0.072 ms
benjguin@benjguinu1605a:~/simpletest$ docker exec n3 ping -c 2 n1
PING n1 (172.19.0.2): 56 data bytes
64 bytes from 172.19.0.2: seq=0 ttl=64 time=0.051 ms
64 bytes from 172.19.0.2: seq=1 ttl=64 time=0.060 ms

--- n1 ping statistics ---
2 packets transmitted, 2 packets received, 0% packet loss
round-trip min/avg/max = 0.051/0.055/0.060 ms
on a Swarm cluster
Let’s now do the same from the master node of my ACS cluster.
network information was added to the docker-compose.yml file:
benjguin@swarm-master-B295EC2C-0:~$ docker exec n2 ping -c 2 n1 PING n1 (10.0.0.2): 56 data bytes 64 bytes from 10.0.0.2: seq=0 ttl=64 time=1.088 ms 64 bytes from 10.0.0.2: seq=1 ttl=64 time=0.830 ms
--- n1 ping statistics --- 2 packets transmitted, 2 packets received, 0% packet loss round-trip min/avg/max = 0.830/0.959/1.088 ms benjguin@swarm-master-B295EC2C-0:~$ docker exec n1 ping -c 2 n2 PING n2 (10.0.0.4): 56 data bytes 64 bytes from 10.0.0.4: seq=0 ttl=64 time=0.671 ms 64 bytes from 10.0.0.4: seq=1 ttl=64 time=0.695 ms
--- n2 ping statistics --- 2 packets transmitted, 2 packets received, 0% packet loss round-trip min/avg/max = 0.671/0.683/0.695 ms benjguin@swarm-master-B295EC2C-0:~$ docker exec n1 ping -c 2 n3 PING n3 (10.0.0.3): 56 data bytes 64 bytes from 10.0.0.3: seq=0 ttl=64 time=1.050 ms 64 bytes from 10.0.0.3: seq=1 ttl=64 time=0.783 ms
--- n3 ping statistics --- 2 packets transmitted, 2 packets received, 0% packet loss round-trip min/avg/max = 0.783/0.916/1.050 ms benjguin@swarm-master-B295EC2C-0:~$ docker exec n2 ping -c 2 n3 PING n3 (10.0.0.3): 56 data bytes 64 bytes from 10.0.0.3: seq=0 ttl=64 time=0.068 ms 64 bytes from 10.0.0.3: seq=1 ttl=64 time=0.076 ms
--- n3 ping statistics --- 2 packets transmitted, 2 packets received, 0% packet loss round-trip min/avg/max = 0.068/0.072/0.076 ms
Conclusion
We have containers in a common network which is described only thru docker means. This works on a single host, and also on multiple hosts (in the example, a host had 1 container, another host had 2 of the 3 containers).